Find what you need


Learn
Manage your money better with our how-to guides and tips
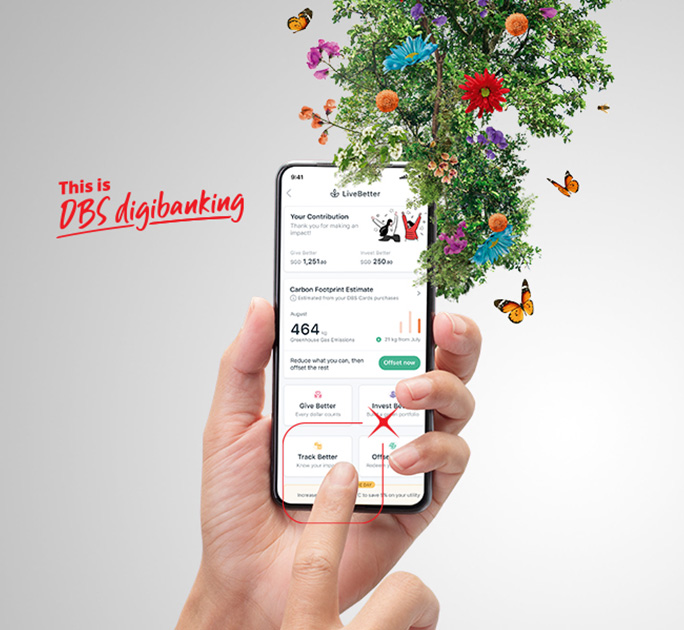
LiveBetter for a sustainable world
Our Green Solutions make it easy and rewarding to go green every day.


Quick Tools
Get the numbers you need here