
- A divergence has formed between North and Southeast Asian exports and manufacturers’ sentiment
- North Asia’s shipments are already weakening on softer electronics demand
- ASEAN-6 exports and sentiment have held up better on commodities support
- Our leading indicators model points to modest Asian export slowdown but still expanding in 4Q22
- Asian exports have in fact done very well through the pandemic and supply chain-related disruptions

Below is a summary. For charts and full report, please download the PDF
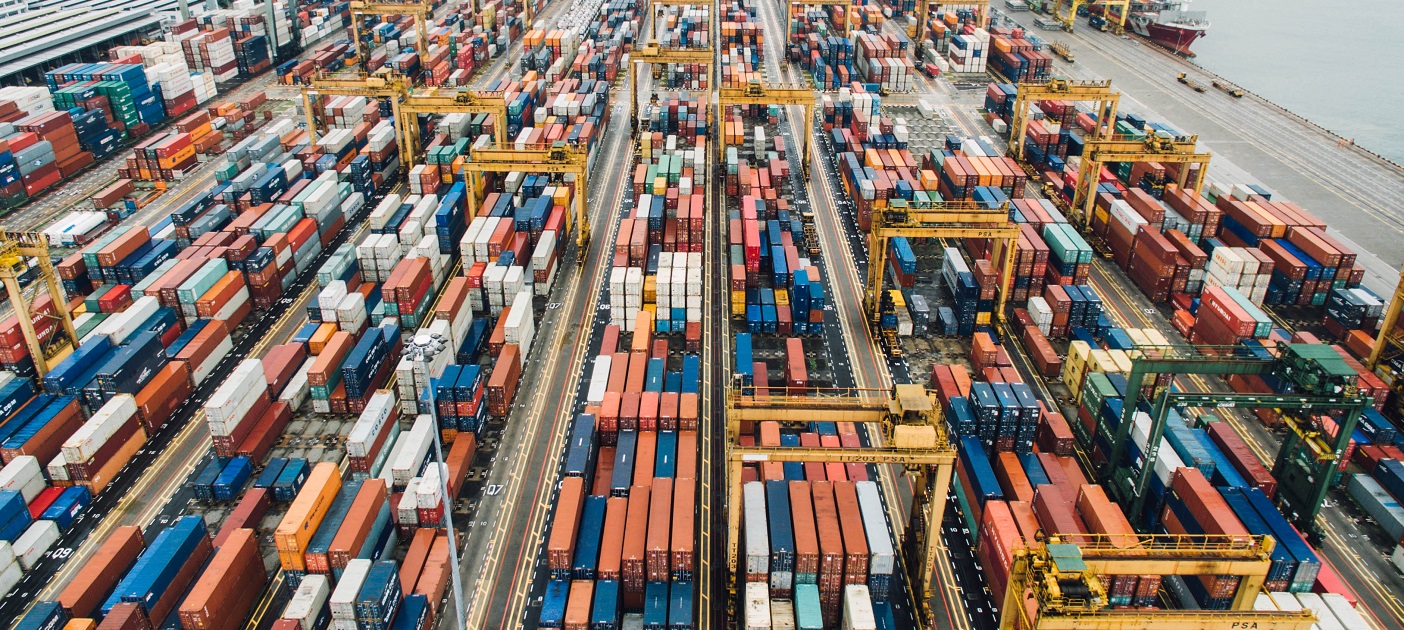
Asia’s goods export growth, a bellwether for global demand, has been resilient so far in 2022 on an aggregate basis. Under the hood, however, we see a divergence between North and Southeast Asia. Entering 4Q22, we reckon a correction of Asian export growth is already in the offing, driven by the combination of tightening global financial conditions and weaker demand, albeit still expanding. For 2023, the outlook is uncertain with downside risks mirrored in our GDP forecasts. Our forecasts see global GDP growth likely easing to 2.5% in 2023, vs 3% in 2022 and 6.2% in 2021 (see Macro Insights Weekly: Higher rates and Macro Insights Weekly: Revising down China for more details).
Aggregate exports resilient so far in 2022
Our measure of aggregate regional exports reflected a respectable outcome so far in 2022, especially when we consider unfavourable base effects from the pick-up from the post-pandemic lockdown last year. Through August, regional exports expanded by double-digits of 13.7% YoY (3-month moving average, 3mma), even though slower than 26.0% at December 2021. Asia’s 3mma aggregate manufacturing purchasing managers’ index (PMI) stayed above expansionary territory at 50.9 in September, but moderated from 52.2 at December 2021.
Asian exports have also by and large been a bright spot through the turbulent pandemic. We remove the messy impact of the start-stop nature of the pandemic by comparing with 2019 data. Our calculations showed that year-to-date regional export nominal values through August 2022 were ~52% higher than the same period around two-three years ago.
Diverging regional exports performance
Just looking at aggregate weighted export growth, however, masks a divergence that has formed between North and Southeast Asia. North Asian goods exports growth from China, South Korea, and Taiwan appears to be softening as electronics demand weakens. Electronics exports account for a sizeable share of total exports for these economies (around 30% for China and Korea, and 50% for Taiwan in 2021). ASEAN-6’s export growth has held its ground this year, partly supported by commodity exports, and in recent months by favourable base effects from last year’s pandemic-related factory disruptions. Separately, India’s overseas shipments have pulled back in the past six months after a strong performance in the previous fiscal year as demand weakens.
China
China’s economy continues to face a bumpy recovery. Our China economists lowered their 2022 and 2023 growth forecasts to 3.0% and 4.0% in early-October. They see growing external headwinds. China’s overall export growth ticked lower to 14.1% YoY, 3mma in August vs 23.1% in December 2021. China’s headline manufacturing PMI inched further lower to contractionary terrain of 48.1 in September, while the new exports orders sub-component also remained weak. A stronger CNY relative to other currencies would also undermine the competitiveness of Chinese goods.
South Korea and Taiwan
South Korea’s and Taiwan’s export cycles have turned lower, alongside manufacturing PMIs that have deepened into contractionary territory since 3Q22. Korean and Taiwanese overall export growth moderated to 6.0% YoY, 3mma and 3.5% YoY, 3mma, respectively, in September, vs ~25% and 26% at December 2021. Their 3mma manufacturing PMIs dropped to contractionary zone of 48.2 and 43.2, respectively, in September, compared with 51.0 and 55.2 at end of last year.
Our economist sees an ongoing tech downturn, reflective of the deterioration in global macroeconomic conditions. Gartner warned in July of weakness in downstream consumer electronics areas like PCs and smartphones, citing the deterioration in global consumer disposable incomes as a result of rising inflation and interest rates.
ASEAN-6
In contrast to North Asia, ASEAN-6 goods exports have outperformed the Asian region. Through August, ASEAN-6 exports expanded by double-digits of 24.4% YoY, 3mma, only slightly weaker than 30.3% as of December 2021, and higher than the Asia weighted aggregate.
ASEAN-6, notably Indonesia and Malaysia, has benefitted from the positive terms of trade shock. The upside shock has been driven by higher commodity prices across the agriculture and energy complex, in part supported by the supply disruptions from the Russia-Ukraine war that broke out since February 2022. Favourable base effects from last year’s pandemic-related factory disruptions have also supported the region’s % YoY performance, such as in Malaysia and Vietnam. Both Indonesian and Malaysian goods exports grew by more than 30% YoY, 3mma in August 2022, vs ~46% and ~27% at December 2021. Vietnam expanded by 16% YoY in September 2022, 3mma vs ~19% at December 2021.
India
India’s export growth has slowed to 13% YoY in April-September 2022 (declining in September 2022) after rising a strong 45% in FY22. Besides the YoY pullback reflecting a high base, the slowdown has been also a function of weakening demand from key trading partners as well as moderation in segments that lifted annual exports to a record last year.
Modest slowdown but positive growth based on leading indicators
With interest rates going up across key demand destinations – especially the US and EU, the rising cost of financing should have a dampening impact on consumer and business spending, affecting the demand for goods produced in Asia.
Our aggregate Asia export growth leading indicator model shows rising headwinds entering 4Q22, but would stay positive at low single-digit. Beyond 2022, the Asian export outlook is uncertain, with risks tilted to the downside in 2023. Our model incorporates five leading variables, using Taiwan export orders, copper prices, South Korea equity prices, China new export orders, and China’s imports from Asia, at various lags and weighted by their statistical relevance to tracking exports (see Appendix in the PDF for methodology details). The z-scores of these five leading variables paint a picture of a modest slowdown for regional international shipments, rather than a cliff-like drop-off.
Even with expectations for a global growth deceleration and rising recessionary fears in 2023 driven by rapidly tightening monetary/financial conditions, aggregate Asian exports nominal values would still have progressed remarkably since the onset of the pandemic, backdrop of supply chain disruptions, and rising economic uncertainties.
To read the full report, click here to Download the PDF.


Topic
The information herein is published by DBS Bank Ltd and/or DBS Bank (Hong Kong) Limited (each and/or collectively, the “Company”). This report is intended for “Accredited Investors” and “Institutional Investors” (defined under the Financial Advisers Act and Securities and Futures Act of Singapore, and their subsidiary legislation), as well as “Professional Investors” (defined under the Securities and Futures Ordinance of Hong Kong) only. It is based on information obtained from sources believed to be reliable, but the Company does not make any representation or warranty, express or implied, as to its accuracy, completeness, timeliness or correctness for any particular purpose. Opinions expressed are subject to change without notice. This research is prepared for general circulation. Any recommendation contained herein does not have regard to the specific investment objectives, financial situation and the particular needs of any specific addressee. The information herein is published for the information of addressees only and is not to be taken in substitution for the exercise of judgement by addressees, who should obtain separate legal or financial advice. The Company, or any of its related companies or any individuals connected with the group accepts no liability for any direct, special, indirect, consequential, incidental damages or any other loss or damages of any kind arising from any use of the information herein (including any error, omission or misstatement herein, negligent or otherwise) or further communication thereof, even if the Company or any other person has been advised of the possibility thereof. The information herein is not to be construed as an offer or a solicitation of an offer to buy or sell any securities, futures, options or other financial instruments or to provide any investment advice or services. The Company and its associates, their directors, officers and/or employees may have positions or other interests in, and may effect transactions in securities mentioned herein and may also perform or seek to perform broking, investment banking and other banking or financial services for these companies. The information herein is not directed to, or intended for distribution to or use by, any person or entity that is a citizen or resident of or located in any locality, state, country, or other jurisdiction (including but not limited to citizens or residents of the United States of America) where such distribution, publication, availability or use would be contrary to law or regulation. The information is not an offer to sell or the solicitation of an offer to buy any security in any jurisdiction (including but not limited to the United States of America) where such an offer or solicitation would be contrary to law or regulation.
This report is distributed in Singapore by DBS Bank Ltd (Company Regn. No. 196800306E) which is Exempt Financial Advisers as defined in the Financial Advisers Act and regulated by the Monetary Authority of Singapore. DBS Bank Ltd may distribute reports produced by its respective foreign entities, affiliates or other foreign research houses pursuant to an arrangement under Regulation 32C of the Financial Advisers Regulations. Singapore recipients should contact DBS Bank Ltd at 65-6878-8888 for matters arising from, or in connection with the report.
DBS Bank Ltd., 12 Marina Boulevard, Marina Bay Financial Centre Tower 3, Singapore 018982. Tel: 65-6878-8888. Company Registration No. 196800306E.
DBS Bank Ltd., Hong Kong Branch, a company incorporated in Singapore with limited liability. 18th Floor, The Center, 99 Queen’s Road Central, Central, Hong Kong SAR.
DBS Bank (Hong Kong) Limited, a company incorporated in Hong Kong with limited liability. 13th Floor One Island East, 18 Westlands Road, Quarry Bay, Hong Kong SAR
Virtual currencies are highly speculative digital "virtual commodities", and are not currencies. It is not a financial product approved by the Taiwan Financial Supervisory Commission, and the safeguards of the existing investor protection regime does not apply. The prices of virtual currencies may fluctuate greatly, and the investment risk is high. Before engaging in such transactions, the investor should carefully assess the risks, and seek its own independent advice.