

FOCUS OF THE WEEK
USD Rates: Relief as Fed Chair Powell sounded balanced. US Treasuries took a sizable relief rally as a trio of events aligned favourably. Yields were drifting lower in the early part of yesterday’s (1 November) session as the quarterly refunding came in at USD112b (slightly lower than consensus of USD114b, with a tilt towards the front and belly tenors) and ISM manufacturing meaningfully missed (actual: 46.7, consensus: 49). The US Federal Reserve’s Open Market Committee (FOMC) also kept the Fed Funds rate (upper bound) steady at 5.50% for the second straight meeting. Most importantly, Fed Chair Powell sounded balanced even as the door for further hikes was kept open. The FOMC statement included a reference to “tighter financial and credit conditions”, suggesting that the rise in long end USD rates seems to be doing the heavy lifting for the Fed and may well necessitate fewer rate hikes. We note that the blowout 300k NFP registered for September has been brushed aside. The less hawkish tilt was also apparent during the press conference where Powell emphasised the need for “proceeding carefully” after delivering 525 bps of hikes in a short time span.
Taken together, the hurdle for further hikes has been set high and this aligns with our view that the Fed is likely done for the cycle. Market pricing has adjusted accordingly, with the odds of another hike in January dropping to 30%, from 40% just before the FOMC statement was released. Further out, the market is looking at just over three cuts by the end of 2024, relatively close to our forecasts of four cuts over the same period.
Meanwhile, 10Y US yields dipped below 4.75%. We think that 2Y and 5Y USD rates have likely peaked but it is too early to call for a sustained rally. Even if further hikes appear less likely, the Fed could keep rates steady for an extended period if the economy (especially the labour market) holds up. NFP due Friday night (3 November) will offer further clues on this front. Lastly, we caution against reading too much into the long-end US Treasury rally. Treasury supply is still sizable and we think that Quantitative Tightening can persist well into 2024. If the Fed turns less hawkish, the odds of a policy mistake (overtightening) reduces and this should lead to a steeper curve, all else equal. 5% is acting as a soft cap for 10Y yields but we are not confident that this rate has already peaked. We maintain our steepening bias for 2Y/10Y and 5Y/30Y.
Figure 1: Fed vs Market
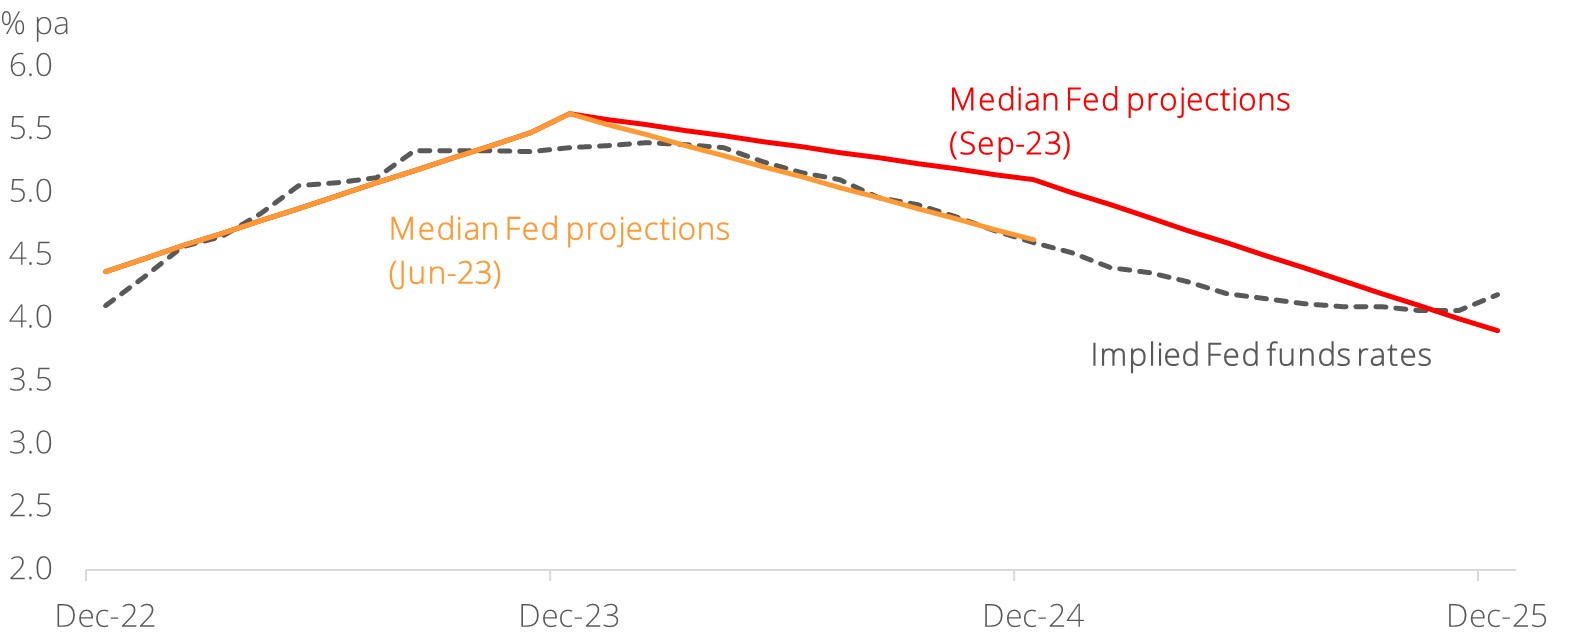
Source: Bloomberg, DBS
MARKET ACTIVATION & PIPELINE OBSERVATIONS
Asia ex-Japan USD Primary Market
Asia ex-Japan USD primary markets supply trickled to a slow last week (ending 27 October). There was just one new issue with Chinese LGFV Fujian Zhanglong Group issuing a USD500m short 3Y Blue Bond.
SGD Primary Market
Tuan Sing Holdings Ltd printed a 4NC3Y senior at 7.50% for a size of SGD150m following their tender offer announcement for their existing bond.
Secondary Markets
USD Secondary Performance
Last week started slow given the Hong Kong holiday. Nonetheless, some light selling of risks was seen as US Treasuries spiked higher during Asian time when the 10Y Treasury yield broke 5%. Against this spike, India HY saw better buying by real money accounts in Asia and Europe. On the other hand, India IG saw some pullback as investors sold duration to capture rate movements. In general, retail flows and ETFs were selling, while real money was two-way. Spreads remained broadly unchanged.
Amongst Chinese SOEs, HAOHUA 30 traded down 165.5 bps, although buyers were seen in other SOEs (e.g. CITLTD, CHGRID and SINOPE). The Technology sector also traded better with TENCNT 30 and 31 up 143 and 142 bps respectively. BABA was well bid, while the Honhai complex saw some dip buyers as it widened 10 bps post headline news. Markets did not appear too concerned about the Chinese investigation. Higher beta Tech names also saw some buying (LENOVO 32 up T+212 and WB 30 up T+290). The Hong Kong space was mixed. Better buyers were seen in HKINTL, MTRC, CKHH, although HKLSP 33 continued to lag. The Singapore space continued to see retail buyers in the Temasek complex, and light two-way interest in TLC names (e.g. KEPSP, PSASP, STSP, SPSP). Bank T2s saw light flows with spreads broadly unchanged.
The early part of the week saw mixed sentiment in China financials. Short-dated papers saw selling flows – Leasing names and China bank T2s 24s saw profit-taking sellers. Elsewhere, investors looked to add duration in 5 to 10Y leasing papers, and credit spreads were c.1 to 2 bps tighter. AT1s saw two-way interest with cash prices largely unchanged. The asset management company (AMC) space saw sellers of CCAMCL perps and buyers of CCAMCL 24s. The rest of the space was mixed, with some selling in up to 3Y Korean papers (e.g. POHANG26, HYUCAP26, and HYUELE26). Better sellers were also seen in some Korea bank T2s (e.g. WOORIB24 and KEBHNB24). The rest of the Korean names saw light, balanced activity. Two-way activity was seen on policy banks KDB and EIBKOR. Malaysia names were quiet with some two-way interest in the PETMK curve – Selling flows were seen in PETMK25, PETMK28, and PETMK32, while saw buying interest was seen in PETMK32. The Thai space continued to see better sellers of bank T2s, with selling interest seen in BBLTB24. Meanwhile, Thai corporates saw better buyers of TOPTB28 and TOPTB30, while the remaining names were muted. India HY was another 25-50c higher but saw better selling from real money, ETFs, and retail investors. Selling was focused on renewables and infrastructure names. However, levels held up as there were also buying flows from Europe (especially on steel/infrastructure names). With this, India HY has recovered about one-third to 50% of the move lower in the past couple of weeks, with India IG being a lot firmer. The Buy/Sell ratio was 3:1, with buying seen across Public Sector Undertaking (PSU) corporates and oil names. Meanwhile, banks and private sector corporates saw balanced two-way flows. Buying was mostly led by real money investors.
Midweek saw US Treasuries sell off on a weaker 5Y auction and stronger home sales numbers. Buying flows were seen on Hong Kong corporates (e.g. CKHH, HKLSP, HKE, HKAA, MTRC). China SOEs were unchanged to slightly tighter. In Chinese Technology, BABA and TENCNT traded slightly tighter but did not see significant activity. There were small two-way flows on the TAISEM curve. Buyers were seen in higher beta names (e.g. MEITUA 25 and 30, LENOVO 32).
The Singapore space saw two-way flows in Temasek long end, driven by retail buyers and profit-taking by institutional investors after the UST rally. The Korean space was quiet with some up trades in KDB 33N at T+91. Thai BBLTB 28 and 33 also lifted slightly tighter. In other recent issues, buyers were seen in NIPLIF 53, MUFG AT1s. In China Financials, small two-way interest was seen in China bank T2s, with credit spreads largely unchanged. China bank AT1s traded up slightly with some onshore buying interest. Leasing long end widened, with some small trades in BOCAVI 33. Recent new issue ICBCAS’ dual-tranche continued to be heavy with more sellers.
The week ended with lackluster flows in India credit. India HY opened with better buying from real money accounts, especially on renewables and infrastructure names. A few fast money accounts were also observed lifting Adani Green papers. India IG was also firm, with better buying seen particularly on EXIMBK, INRCIN, and POWFIN complexes. AT1s and corporate perps saw active two-way flows between real money accounts.
SGD Secondary Performance
It was a slower start in the early part of last week with SGD credit activity muted on the back of softer equity performance. An uptick in activities was led by asset managers and rebalancing flows from the lifer community. Better selling was seen from this group of real money accounts, with de-risking seen among European AT1s and property names, coupled with light selling flows on a series of good quality names in the later part of the week.
Retail investors saw a mixed session with light activity in the recently printed CMZB and in the HSBC complexes, while profit-taking flows were seen in AIAs and AT1s. It was relatively quiet among non-financials from retail investors, save for some light buying interest in TLC corporate perpetuals.
The week ended with markets picking up slightly, which facilitated some recovery and risk appetite in credits, led once again by the more opportunistic retail investors. Balanced two-way flows were observed amongst retail investors, across both financials and non-financials. Overall, flows remained lighter, as most investors remained on the sidelines awaiting the outcome of the upcoming Fed meeting to see if rates would remain elevated.
Download the PDF to read the full report.
Topic
DISCLAIMERS AND IMPORTANT NOTES
This information herein is published by DBS Bank Ltd. (“DBS Bank”) and is for information only. This publication is intended for DBS Bank and its subsidiaries or affiliates (collectively “DBS”) and clients to whom it has been delivered and may not be reproduced, transmitted or communicated to any other person without the prior written permission of DBS Bank.
This publication is not and does not constitute or form part of any offer, recommendation, invitation or solicitation to you to subscribe to or to enter into any transaction as described, nor is it calculated to invite or permit the making of offers to the public to subscribe to or enter into any transaction for cash or other consideration and should not be viewed as such.
The information herein may be incomplete or condensed and it may not include a number of terms and provisions nor does it identify or define all or any of the risks associated to any actual transaction. Any terms, conditions and opinions contained herein may have been obtained from various sources and neither DBS nor any of their respective directors or employees (collectively the “DBS Group”) make any warranty, expressed or implied, as to its accuracy or completeness and thus assume no responsibility of it. The information herein may be subject to further revision, verification and updating and DBS Group undertakes no responsibility thereof.
All figures and amounts stated are for illustration purposes only and shall not bind DBS Group. DBS Group does not act as an adviser and assumes no fiduciary responsibility or liability for any consequences, financial or otherwise, arising from any arrangement or entrance into any transaction in reliance on the information contained herein. The information herein does not have regard to the investment objectives, financial situation and particular needs of any specific person. In order to build your own independent analysis of any transaction and its consequences, you should consult your own independent financial, accounting, tax, legal or other competent professional advisors as you deem appropriate to ensure that any assessment you make is suitable for you in light of your own financial, accounting, tax, and legal constraints and objectives without relying in any way on DBS Group or any position which DBS Group might have expressed in this document or orally to you in the discussion.
Companies within the DBS Group or the directors or employees of the DBS Group or persons/entities connected to them may have positions in and may affect transactions in the underlying product(s) mentioned. Companies within the DBS Group may have alliances or other contractual agreements with the provider(s) of the underlying product(s) to market or sell its product(s). Where companies within the DBS Group are the product provider, such company may be receiving fees from the investors. In addition, companies within the DBS Group may also perform or seek to perform broking, investment banking and other banking or financial services to the companies or affiliates mentioned herein.
This publication may include quotation, comments or analysis. Any such quotation, comments or analysis have been prepared on assumptions and parameters that reflect our good faith, judgement or selection and therefore no warranty is given as to its accuracy, completeness or reasonableness. All information, estimates, forecasts and opinions included in this document or orally to you in the discussion constitute our judgement as of the date indicated and may be subject to change without notice. Changes in market conditions or in any assumptions may have material impact on any estimates or opinion stated.
Prices and availability of financial instruments are subject to change without notice. Any information relating to past performance, or any future forecast based on past performance or other assumptions, is not necessarily a reliable indicator of future results. Future results may not meet our/ your expectations due to a variety of economic, market and other factors.
This publication has not been reviewed or authorised by any regulatory authority in Singapore, Hong Kong, Dubai International Financial Centre, United Kingdom or elsewhere. There is no planned schedule or frequency for updating research publication relating to any issuer.
If this publication has been distributed by electronic transmission, such as e-mail, then such transmission cannot be guaranteed to be secure or error-free as information could be intercepted, corrupted, lost, destroyed, arrive late or incomplete, or contain viruses. The sender therefore does not accept liability for any errors or omissions in the contents of the Information, which may arise as a result of electronic transmission. If verification is required, please request for a hard-copy version.
The investment product(s) mentioned herein is/are not the only product(s) that is/are aligned with the views stated in the research report(s) and may not be the most preferred or suitable product for you. There are other investment product(s) available in the market which may better suit your investment profile, objectives and financial situation.
This publication is not directed to, or intended for distribution to or use by, any person or entity who is a citizen or resident of or located in any locality, state, country or other jurisdiction where such distribution, publication, availability or use would be contrary to law or regulation.
Country Specific Disclaimer
This publication is distributed by DBS Bank Ltd (Company Regn. No. 196800306E) ("DBS") which is an Exempt Financial Adviser as defined in the Financial Advisers Act and regulated by the Monetary Authority of Singapore (the "MAS").
This publication is provided to you as an “Accredited Investor” (defined under the Securities and Futures Act of Singapore and the Securities and Futures (Classes of Investors) Regulations 2018) or an “Institutional Investor” (defined under the Securities and Futures Act of Singapore and the Securities and Futures (Classes of Investors) Regulations 2018) for your private use only and may not be passed on or disclosed to any person nor copied or reproduced in any manner.